
A landing page may look visually appealing, but appearance alone doesn't guarantee conversions. The real question is how visitors interact with your page. Do they click your call-to-action (CTA)? Do they scroll far enough to see your offer? Are they ignoring important sections altogether?
Without behavioral data, marketers often rely on assumptions when optimizing landing pages. This can lead to ineffective design changes and missed opportunities to improve conversion rates.
Leadpages Heatmaps solve this problem by providing a visual representation of user behavior. Instead of guessing where visitors click or how far they scroll, heatmaps reveal exactly how people interact with your landing pages.
In this guide, we'll explain how Leadpages Heatmaps work, the insights they provide, and how businesses can use them to create more effective, high-converting landing pages.
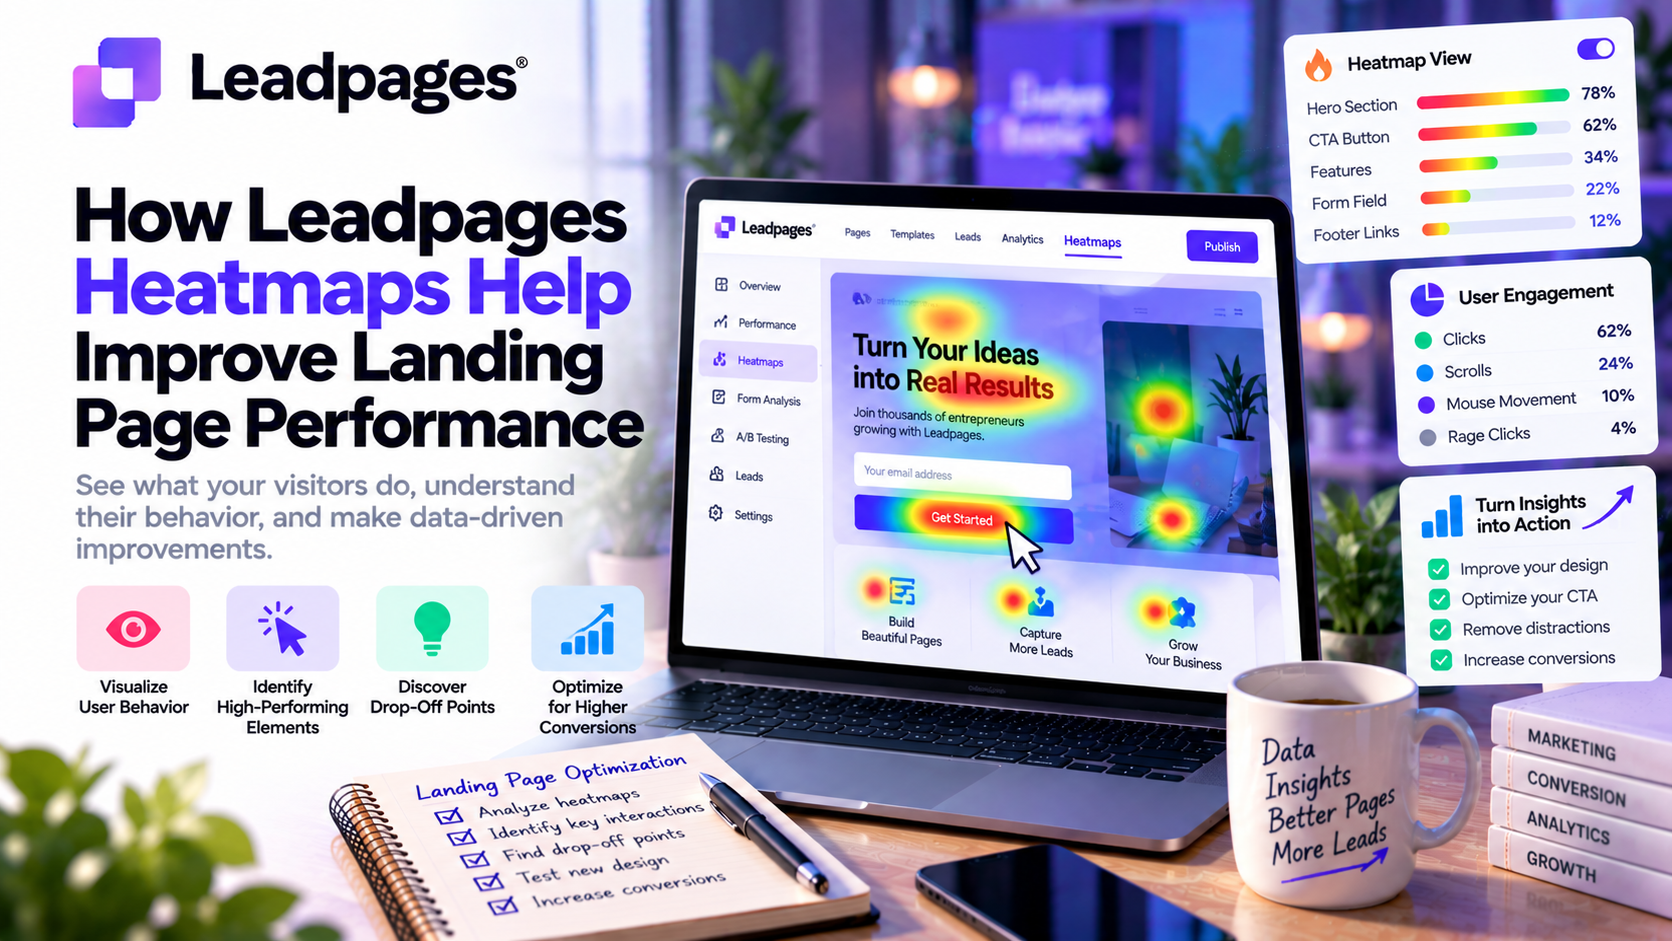
What Are Heatmaps?
A heatmap is a visual analytics tool that displays how visitors interact with a webpage using color-coded indicators.
Areas with the highest engagement appear in warmer colors (such as red, orange, or yellow), while areas with little interaction appear in cooler colors (such as blue or green).
Instead of reading spreadsheets filled with analytics data, marketers can quickly understand visitor behavior by looking at the visual patterns on a page.
Heatmaps help answer questions like:
- Where do visitors click?
- How far do users scroll?
- Which content receives the most attention?
- Which sections are ignored?
- Are visitors interacting with the CTA?
These insights make it easier to identify opportunities for optimization.
Why Heatmaps Matter
Traditional analytics platforms can tell you what happened.
For example:
- 2,000 page views
- 120 conversions
- 6% conversion rate
However, analytics often cannot explain why visitors behaved that way.
Heatmaps provide the missing context by showing how users actually engage with a landing page.
This helps marketers understand:
- Why visitors leave without converting
- Why certain buttons receive few clicks
- Whether important content is being overlooked
- How users navigate the page
Understanding user behavior is essential for improving conversion rates.
Types of Insights Provided by Leadpages Heatmaps
1. Click Heatmaps
Click Heatmaps show where users click most frequently.
This allows marketers to determine whether visitors are interacting with:
- Call-to-action buttons
- Images
- Navigation links
- Product features
- Testimonials
- Pricing sections
If visitors repeatedly click on non-clickable elements, it may indicate confusion and suggest an opportunity to improve the page design.
2. Scroll Heatmaps
Not every visitor reaches the bottom of a landing page.
Scroll Heatmaps reveal how far users scroll before leaving.
This information helps answer questions such as:
- Are visitors seeing the pricing section?
- Is the contact form too far down the page?
- Are testimonials placed too low?
- Is the CTA visible early enough?
If most users stop scrolling before reaching your primary CTA, moving it higher on the page may improve conversions.
3. Engagement Patterns
Heatmaps also reveal which sections receive the most attention.
For example, marketers can identify whether visitors spend more time reading:
- Customer testimonials
- Product benefits
- Pricing information
- Feature lists
- FAQ sections
These insights help businesses prioritize the content that matters most to potential customers.
How Leadpages Heatmaps Improve Landing Pages
Optimize Call-to-Action Placement
The CTA is one of the most important elements on any landing page.
Heatmaps can reveal:
- Whether visitors notice the button
- If users click it
- Whether it should be moved higher
- If multiple CTAs create confusion
A simple adjustment in CTA placement can significantly increase conversion rates.
Improve Page Layout
Sometimes visitors ignore entire sections of a landing page.
Heatmaps make these problem areas immediately visible.
Businesses can then:
- Rearrange sections
- Remove unnecessary content
- Highlight key benefits
- Improve visual hierarchy
Cleaner layouts often lead to better user experiences.
Reduce Bounce Rates
If users leave the page after viewing only the top section, the introduction may not be compelling enough.
Heatmaps help marketers identify:
- Weak headlines
- Confusing layouts
- Poor image placement
- Missing trust signals
Fixing these issues encourages visitors to continue exploring the page.
Increase Form Completion
Lead generation depends on visitors completing forms.
Heatmaps can identify whether users:
- Reach the form
- Ignore the form
- Stop scrolling before the form appears
If the form receives little attention, businesses may improve performance by:
- Moving it higher
- Simplifying the layout
- Reducing the number of required fields
Combining Heatmaps with A/B Testing
Heatmaps become even more valuable when combined with A/B testing.
For example:
A/B testing may show that Version B converts 18% better than Version A.
Heatmaps explain why.
Perhaps visitors:
- Clicked the CTA more frequently
- Scrolled further
- Spent more time reading testimonials
- Engaged with pricing information
Together, these tools provide both quantitative and qualitative insights into user behavior.
Best Practices for Using Leadpages Heatmaps
Analyze High-Traffic Pages First
Focus on landing pages that receive the most visitors.
Optimizing pages with significant traffic typically produces the greatest return on effort.
Look for Behavioral Patterns
Avoid making decisions based on individual visitors.
Instead, identify consistent trends across hundreds or thousands of sessions.
Patterns provide more reliable optimization opportunities.
Prioritize High-Impact Changes
Not every observation requires immediate action.
Focus first on improvements involving:
- Headlines
- CTA placement
- Forms
- Hero sections
- Trust signals
These elements often have the greatest influence on conversions.
Continue Monitoring After Changes
Optimization is an ongoing process.
After updating a landing page, review new heatmap data to determine whether user behavior has improved.
Continuous refinement leads to better long-term performance.
Common Mistakes to Avoid
Many marketers misunderstand heatmap data.
Avoid these common mistakes:
❌ Assuming every click is valuable
❌ Ignoring mobile user behavior
❌ Making major changes after reviewing only a small amount of data
❌ Focusing only on clicks instead of overall user journeys
❌ Forgetting to test improvements after implementing changes
Heatmaps provide valuable insights, but they work best when combined with analytics and A/B testing.
Real-World Use Cases
SaaS Companies
Improve free trial landing pages by identifying where potential customers lose interest.
Ecommerce Stores
Optimize promotional pages by understanding how shoppers interact with product images, discounts, and purchase buttons.
Marketing Agencies
Use heatmaps to improve client landing pages and demonstrate measurable optimization results.
Coaches and Consultants
Identify whether visitors engage with testimonials, pricing information, and consultation booking forms.
Local Businesses
Improve appointment booking pages by making forms and contact information easier to find.
Why Leadpages Heatmaps Stand Out
Many businesses rely on separate heatmap software, requiring additional subscriptions and integrations.
Leadpages includes heatmaps as part of its optimization toolkit, allowing marketers to:
- Analyze visitor behavior
- Improve landing pages
- Test changes
- Monitor results
—all within a single platform.
This streamlined workflow saves time and makes conversion optimization more accessible, especially for small businesses and growing marketing teams.
Final Verdict
Leadpages Heatmaps provide marketers with valuable insights that go beyond traditional analytics. Instead of simply reporting page views or conversion rates, they visually demonstrate how visitors interact with landing pages—revealing where they click, how far they scroll, and which content captures their attention.
These behavioral insights help businesses make informed decisions about layout, content placement, and calls-to-action, leading to better user experiences and higher conversion rates. When combined with A/B testing and performance analytics, heatmaps become an essential tool for continuous optimization.
For marketers who want to stop guessing and start improving landing pages based on real user behavior, Leadpages Heatmaps offer a practical and data-driven solution.







Write Your Review
No reviews yet. Be the first to share your experience!