
Businesses generate enormous amounts of data every day. Projects move through multiple stages, sales teams close deals, marketing campaigns generate leads, customer support resolves tickets, and HR departments onboard new employees. While this information is valuable, it often becomes scattered across spreadsheets, emails, and disconnected software, making it difficult to gain a clear picture of business performance.
Managers and executives need more than raw data—they need actionable insights. They need to know whether projects are on schedule, which teams are overloaded, where budgets are being spent, and whether business goals are being achieved.
This is where monday.com Dashboards become one of the platform's most valuable features.
Dashboards transform data from multiple boards into interactive visual reports, allowing teams to monitor key performance indicators (KPIs), identify bottlenecks, and make informed decisions in real time. Instead of manually collecting information from different departments, users can access a centralized overview of their operations through customizable charts, graphs, workload reports, and performance metrics.
In this article, we'll explore how monday.com Dashboards work, their key features, practical business applications, advantages, limitations, and best practices for building dashboards that support better decision-making.
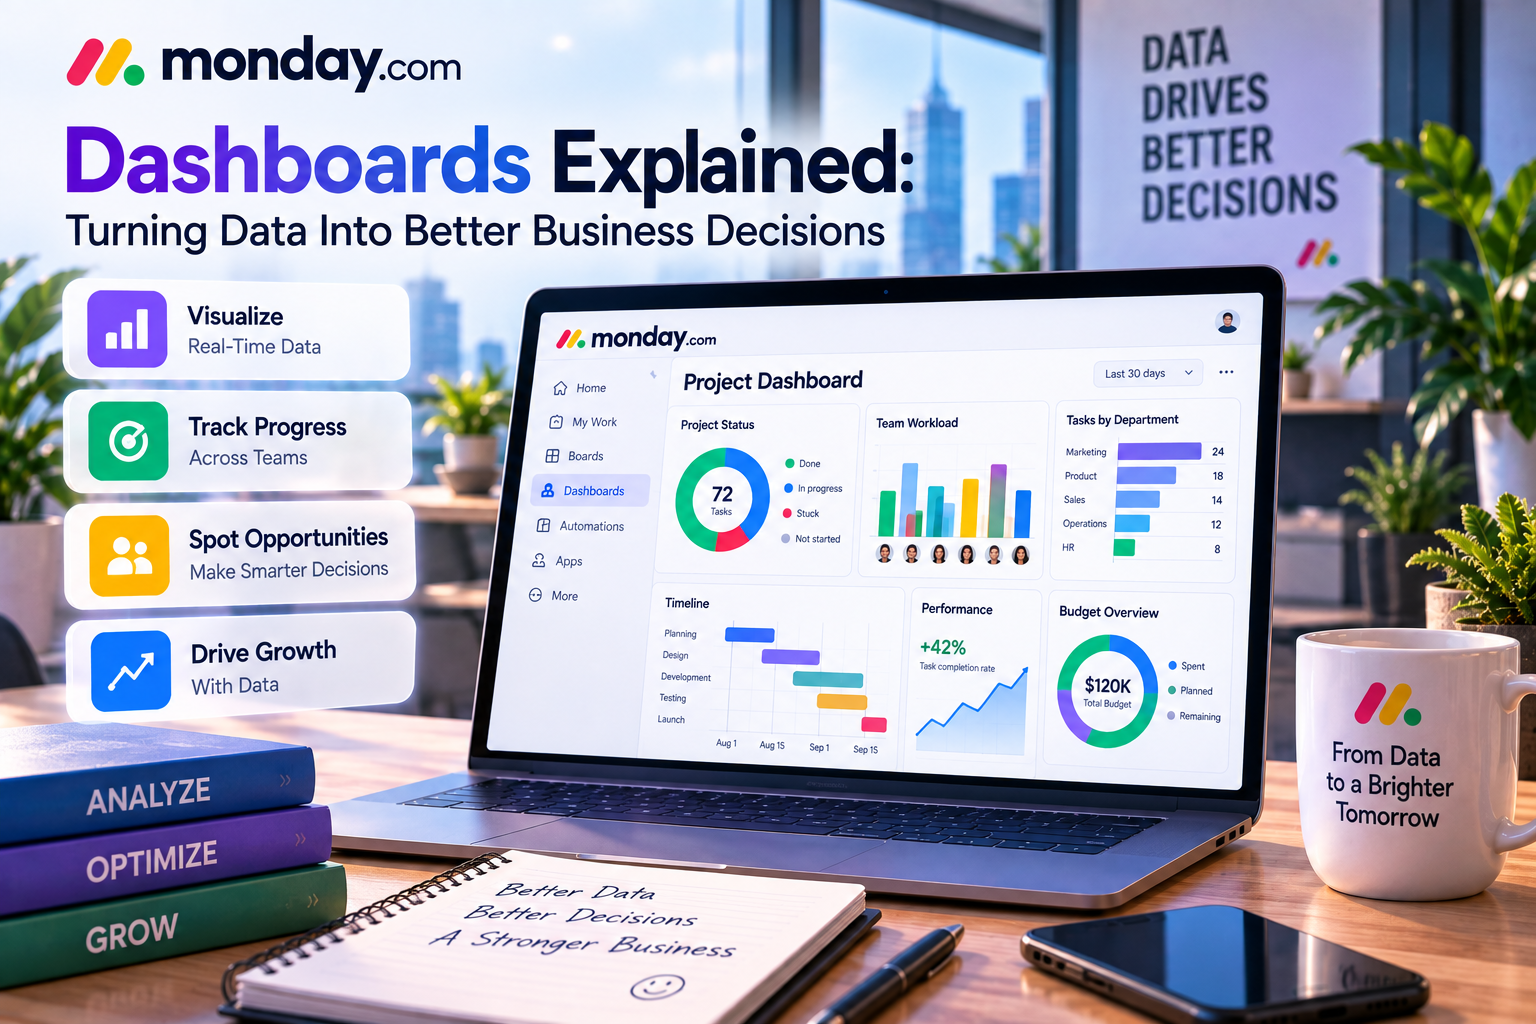
What Are monday.com Dashboards?
A dashboard in monday.com is a customizable workspace that combines data from one or multiple boards into a single visual interface.
Rather than opening individual projects to check progress, users can monitor business performance from one location.
Dashboards display information through widgets such as:
- Charts
- Numbers
- Battery indicators
- Calendar views
- Workload reports
- Timeline widgets
- Progress bars
- Tables
- Time tracking reports
- Maps
Because dashboards update automatically as data changes, decision-makers always have access to current information.
Why Dashboards Matter
Without dashboards, managers often spend hours gathering information before making decisions.
Consider a marketing director managing several campaigns.
To understand overall performance, they may need to:
- Review campaign spreadsheets
- Check advertising reports
- Read project updates
- Contact team members
- Verify deadlines
- Compare budgets
This process is slow and increases the risk of overlooking important details.
A dashboard consolidates all this information into one screen, making it easier to identify trends, monitor progress, and respond quickly to changing priorities.
Key Features of monday.com Dashboards
1. Customizable Dashboard Widgets
One of the biggest strengths of monday.com Dashboards is flexibility.
Users can choose from a wide variety of widgets depending on the information they want to monitor.
Popular widgets include:
- Chart Widget
- Battery Widget
- Numbers Widget
- Timeline Widget
- Calendar Widget
- Workload Widget
- Table Widget
- Time Tracking Widget
This allows every department to build dashboards tailored to its own objectives.
2. Multiple Board Reporting
Most businesses manage work across several departments.
Marketing, sales, HR, finance, and product teams often maintain separate boards.
Dashboards can combine information from multiple boards into one unified report.
For example, a CEO can monitor:
- Sales revenue
- Marketing campaign status
- Product development progress
- Customer onboarding
- HR recruitment
without switching between different workspaces.
3. Real-Time Data Updates
Unlike traditional reports that require manual updates, monday.com Dashboards automatically refresh as team members update their boards.
When a task changes status or a project reaches a milestone, the dashboard reflects those changes immediately.
This enables managers to make decisions based on current information rather than outdated reports.
4. KPI Monitoring
Key Performance Indicators (KPIs) help businesses measure success.
Dashboards allow organizations to monitor metrics such as:
- Project completion rate
- Budget utilization
- Revenue targets
- Team workload
- Customer satisfaction
- Lead conversion rate
- Average response time
Instead of manually calculating KPIs, monday.com displays them visually and updates them automatically.
5. Workload Management
One of the most valuable dashboard features is workload visualization.
Managers can instantly identify:
- Employees with excessive workloads
- Available team capacity
- Resource bottlenecks
- Departments requiring additional support
Balanced workloads improve productivity while reducing employee burnout.
Real-World Business Use Cases
Marketing Campaign Dashboard
Marketing teams often manage dozens of campaigns simultaneously.
A dashboard can display:
- Campaign status
- Content production progress
- Advertising budgets
- Social media schedules
- Lead generation metrics
Instead of checking separate boards, marketing managers gain a complete overview in one place.
Sales Performance Dashboard
Sales leaders need visibility into pipeline performance.
A dashboard can track:
- New leads
- Qualified opportunities
- Closed deals
- Monthly revenue
- Win rates
- Sales representative performance
Real-time reporting helps managers identify trends and adjust sales strategies quickly.
Project Management Dashboard
Project managers can monitor:
- Task completion
- Upcoming deadlines
- Project milestones
- Resource allocation
- Risks
- Budget consumption
This improves planning and reduces project delays.
Human Resources Dashboard
HR teams can build dashboards to monitor:
- Open positions
- Candidate pipeline
- Interview schedules
- Employee onboarding
- Training progress
Automated reporting simplifies workforce management.
Executive Dashboard
Executives require high-level business insights.
An executive dashboard may combine information from every department, including:
- Revenue
- Project health
- Customer support performance
- Marketing ROI
- Operational KPIs
This enables leadership teams to make faster strategic decisions.
Dashboard Widgets Explained
Chart Widget
Visualizes data using bar charts, line graphs, or pie charts.
Best for:
- Revenue trends
- Project status
- Team performance
Numbers Widget
Displays important metrics such as:
- Total revenue
- Active projects
- Completed tasks
Ideal for executive summaries.
Battery Widget
Shows project progress using percentage indicators.
Useful for monitoring completion rates.
Workload Widget
Visualizes team capacity and resource allocation.
Helps managers avoid overloading employees.
Timeline Widget
Displays project schedules and milestones.
Useful for product launches and long-term planning.
Calendar Widget
Shows upcoming deadlines and scheduled activities.
Perfect for marketing and content teams.
Benefits of monday.com Dashboards
Better Decision-Making
Managers gain instant access to accurate information, allowing them to respond quickly to changing business conditions.
Improved Transparency
Every stakeholder sees the same real-time information, reducing misunderstandings and improving collaboration.
Increased Productivity
Employees spend less time preparing reports and more time executing meaningful work.
Stronger Accountability
Clear performance metrics encourage ownership and responsibility across teams.
Easier Executive Reporting
Leadership teams can review company performance without requesting manual updates from every department.
Best Practices for Building Effective Dashboards
Focus on Business Goals
Every dashboard should answer specific business questions rather than displaying unnecessary data.
Keep It Simple
Too many widgets can overwhelm users.
Highlight only the most important KPIs.
Use Multiple Dashboards
Instead of building one massive dashboard, create separate dashboards for:
- Marketing
- Sales
- HR
- Finance
- Executive reporting
Review Regularly
As business priorities evolve, dashboards should be updated to reflect new goals and metrics.
Combine Dashboards with Automation
Automation can update project statuses automatically, ensuring dashboard data remains accurate without manual effort.
Advantages of monday.com Dashboards
✔ Real-time reporting
✔ Easy-to-understand visualizations
✔ Highly customizable
✔ Supports multiple departments
✔ Excellent KPI tracking
✔ Better resource management
✔ Scales with business growth
Potential Limitations
While dashboards are extremely useful, users should be aware of a few considerations:
- Advanced dashboard functionality may require higher-tier plans.
- Building highly customized dashboards may require some initial planning.
- Poorly organized boards can lead to confusing reports.
- Too many widgets may reduce dashboard readability.
Fortunately, these issues can usually be resolved through thoughtful dashboard design and regular maintenance.
monday.com Dashboards vs Traditional Reporting
| Feature | monday.com Dashboards | Traditional Spreadsheets |
|---|---|---|
| Real-time updates | ✔ Yes | ✘ No |
| Visual reporting | ✔ Excellent | Limited |
| Collaboration | ✔ Built-in | Manual |
| KPI tracking | ✔ Automated | Manual |
| Multi-board reporting | ✔ Yes | Difficult |
| Customization | ✔ High | Moderate |
For organizations moving beyond spreadsheets, dashboards offer significant improvements in visibility and efficiency.
Final Verdict
Data is only valuable when it leads to better decisions.
monday.com Dashboards help businesses transform scattered project information into clear, actionable insights through real-time reporting and customizable visualizations.
Whether you're managing marketing campaigns, monitoring sales pipelines, tracking software development, or overseeing company-wide operations, dashboards provide the visibility needed to improve performance and identify issues before they become serious problems.
Combined with automation, AI-powered workflows, and flexible project management capabilities, dashboards make monday.com more than just a task management platform—they turn it into a comprehensive business operating system.
For organizations that rely on data-driven decision-making, monday.com Dashboards are one of the platform's most powerful and valuable features.

Write Your Review
No reviews yet. Be the first to share your experience!